Improving climate attribution methodology with machine learning
Observational climate data gaps remain a critical challenge in the Global South, particularly in regions where populations are most vulnerable to extreme weather and climate events. As the frequency and intensity of these events increase due to anthropogenic climate change, robust climate attribution studies are essential to inform climate litigation and operationalize the U.N. Loss and Damage Fund, which aims to provide financial support to affected nations. However, high-quality attribution studies require long, homogeneous climate records—data that is often unavailable in these regions.
To address this gap, we develop a gridded climate extremes observational dataset for the Global South by training a convolutional neural network on masked climate model simulations, leveraging observational datasets from multiple international sources. This methodology has the potential to enhance attribution science, strengthen evidence for climate litigation, and support just compensation for climate-affected communities.
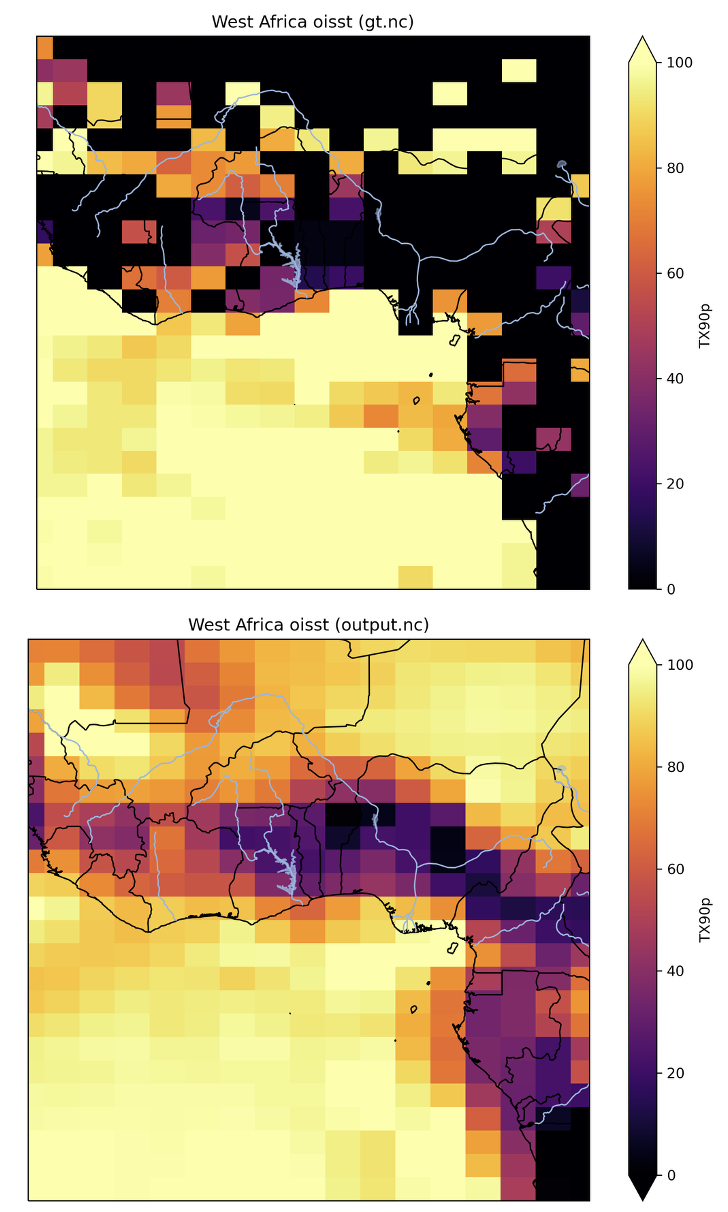
Percentage of January 2000 days with temperatures above the climatological 90th percentile. The top figure features data from station data and sea surface temperature observations (notice the gap in land coverage). The bottom is the infilled dataset once a machine learning model is trained to fill in station data gaps with CMIP data.
Identifying a physical mechanism to justify AI
Machine learning (ML) is an exciting tool climate scientists can use to further understand our changing atmosphere. During my PhD, we analyzed the sensitivity of Southwest U.S. (SWUS) precipitation to changes in sea surface temperature (SST) using both an ML and a Green’s function (GF) approach. Using explainable AI, we found that the ML approach identified South-Central Pacific SSTs as having the most influence on SWUS precipitation.
But what if this connection between South-Central Pacific SSTs and SWUS precipitation is purely statistical? How do we know there’s a dynamical mechanism at play here?
To analyze the physical mechanism underpinning this supposed teleconnection, we ran an atmospheric GCM simulation informed by the ML’s learned relationship. We found that a warming of the South-Central Pacific shifts the ITCZ south, leading to a stronger northern Hadley Cell branch, increased subsidence in the North Pacific, and a deeper trough in the North Pacific. This shifts the position of the northern subtropical Pacific jet over the SWUS leading to more precipitation.
This project is the first to our knowledge that uses explainable AI to inform an AGCM simulation setup to prove a physical connection or causality between the predictor and the predictand.

10-year averaged vertical velocity (top row) and v-wind (middle row) zonal-mean anomaly for an AGCM simulation with positive SST anomalies informed by the ML method (left column) and an AGCM simulation with negative SST anomalies (right column). The zonal mean is only taken over the Pacific basin (120 E to 285 E). U-wind at 850 mb anomaly maps (bottom row). In the left column, we see a physical mechanism connection South-Central Pacific SSTs to SWUS precipitation informed by explainable AI.
How does climate model error in the evolution of sea surface temperatures affect temperature and precipitation projections?
Atmosphere-ocean general circulation models (AOGCMs) are the primary tool climate scientists use in predicting the effects of climate change. While they have skill in reproducing global-mean temperature over the historical period, they struggle to replicate recently observed sea surface temperature (SST) trend patterns. For these projects, we were curious how this may affect projections of variables like temperature and precipitation. We primarily use a Green’s function (GF) approach to identify which SST regions are most relevant for changes in these variables. Our findings demonstrate significant sensitivity of both global-mean temperature and SWUS precipitation to the pattern of sea surface warming, meaning that a continuation of AOGCM error in SST trend patterns adds further uncertainty to climate projections. It is critical for climate change adaptation and mitigation assessments to consider this previously unaccounted for uncertainty in climate projections until we fully trust the evolution of SST patterns in AOGCMs.

The response of the annual- and global-mean net TOA radiation Green’s Function.
Statistical post-processing of multi-physics WRF ensemble forecasts
Numerical weather prediction requires a form of statistical post-processing due to representational error (model grid not matching terrain), model error, and observational/assimilation error. After Model Output Statistics was created in the early 1970s, reliable deterministic forecasts could be issued for locations in complex terrain. However, MOS provided only a single, non-probabilistic forecast, which could not account for the chaotic nature of the atmosphere. Ensemble weather prediction began in the 1990s, and similar to deterministic forecasts, had to be post-processed due to under-dispersion.
For my master’s thesis project, entitled “Statistical Post-Processing of Ensemble WRF Forecasts for Microclimatic Regions in the U.S. Northeast,” we utilized the Weather Research and Forecasting model (WRF) to produce 9 km and 3 km resolution forecasts from the Global Forecast System (GFS) model for microclimatic, agricultural regions in the U.S. Northeast. These forecasts were then statistically post-processed to generate probabilistic forecasts for temperature, specific humidity, incoming solar radiation, and precipitation. A comparison of forecast skill was conducted between these post- processed forecasts, the raw WRF output, the GFS forecasts, and forecasts from the National Weather Service’s National Digital Forecast Database (NDFD). Overall, significant improvement was observed in post-processed WRF forecasts over all other methods for all regions and variables. Furthermore, NDFD was found to be competitive with raw WRF for temperature, so that if observational data is unavailable for post-processing, the NDFD forecast method should be selected over running high resolution ensemble WRF. Finally, the 9 km post-processed WRF had the same forecast skill as the 3 km post-processed WRF, rendering the 3 km WRF unnecessary if observational data is available, saving computational cost.

Example temperature forecast initiated at 00:00Z April 2, 2017 for one Finger Lakes station. Left: ensemble member temperatures (thin blue lines) are plotted over a three-day period with observations (black). Center: the raw probabilistic forecast for 57Z (thick blue line) is plotted with the ensemble member temperature forecasts (thin vertical blue lines), the NGR probabilistic forecast (thick orange line) and observation (vertical black line). Right: the 75th, 95th, and 99th percentile post-processed CDF regions (orange) are plotted with the observations (black).

Mean absolute error (MAE) and continuous ranked probability scores (CRPS) for deterministic and probabilistic forecast methods for temperature (left), specific humidity (center), and solar radiation (right). These scores are aggregated across all forecasts for all stations.

Reliability diagram for a temperature threshold of 0°C aggregated for Finger Lakes stations. Post-processed WRF improves over raw model output even in the most extreme frost events during the growing season.
Land-atmosphere coupling strength during Northeast drought
Land-atmosphere coupling in the Northeastern United States (Northeast) was found to be negligible in previous studies. However, a flash drought during the summer of 2016 may have indicated otherwise. This period was one of the warmest and driest in the Northeast, especially in parts of New York State, with below average streamflow levels from decreased snowpack during the preceding winter, and depleted soil moisture values indicated by anomalously low PDSI. During the summer of 2016, we found that a positive soil moisture-rainfall feedback developed, leading to greater interaction between the land and the atmosphere, which strengthened the drought. In future climatic regimes, conditions observed during the 2016 drought are predicted to become more frequent, for example soil moisture levels may decrease due to warmer temperatures and greater evapotranspiration. As soil moisture decreases, less moisture is available for convective initiation during the summer, decreasing precipitation, which further decreases soil moisture levels, in accordance with positive feedback theory. A positive feedback is indicative of a stronger land-atmosphere coupling under a warmer climate regime. More generally, we tested the theoretical framework of land-atmosphere coupling in the Northeast as the climate warms.

Averaged sensible heat (solid green) and latent heat (solid red) fluxes for Ithaca, NY during a summer 2015 WRF run. Dashed lines represent a summer 2015 WRF run with all soil moisture values modified to 0.1 m^3/m^3. During the dry soil moisture scenario, the sensible heat flux is much larger than the latent heat flux, indicating a significant change in the Bowen ratio.